Wholesale Product Sales Rose 1% in October

December 16, 2020
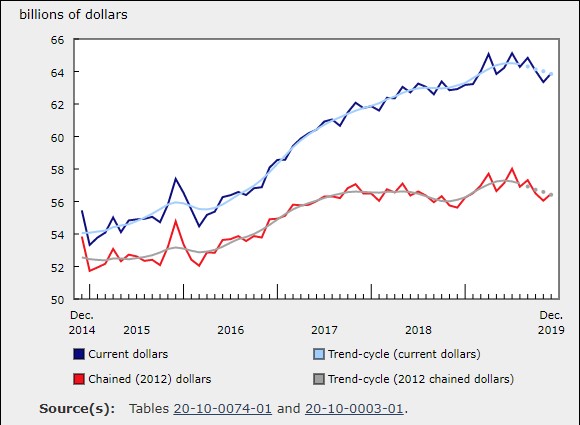
The sale of wholesale products rose 1.0% in October to $66.7 billion, marking the sixth consecutive increase for the sector. Gains in three subsectors — machinery, equipment and supplies • motor vehicles and motor vehicle parts and accessories • building material and supplies subsectors — all contributed to the growth, which was partially offset by declines in the food, beverage and tobacco, and personal and household goods subsectors.
Sales volumes grew 1.0% in October.
Sales higher than pre-COVID-19 levels before pandemic’s second wave
There is evidence to suggest that the wholesale sector was able to stabilize itself to a large degree before the Canadian economy entered the second wave of the pandemic at the beginning of November. By many measures, the wholesale sector was better off in October than it was in February, before the onset of COVID-19 restrictions.
October sales were 3.3% higher than pre-pandemic levels, and for the second consecutive month all subsectors except for motor vehicles and motor vehicle parts and accessories recorded sales that were higher than those in February 2020.
The building material and supplies subsector has surpassed pre-pandemic sales levels more than any other subsector, with October sales 9.9% higher than February 2020. The machinery, equipment and supplies, and the miscellaneous subsectors both posted sales in October that were more than 5% higher than pre-pandemic levels. Although sales of motor vehicles and motor vehicle parts and accessories were still lower than February 2020, the subsector has had six consecutive months of gains, with October’s 3.1% increase being the largest since July. Sales of motor vehicles and motor vehicle parts and accessories have risen from $3.0 billion in April to $11.3 billion in October, and were 3.2% below February’s level.
On a year-over-year basis, sales in October were up 5.2%, and all subsectors posted higher sales in October 2020 compared to the same month in the previous year.
As noted in the September release on wholesale trade, the increases in the wholesale sector may largely stem from a substitution effect as spending on services remains far below pre-pandemic levels. For example, data from September 2020 (the most recently available) indicates that tourism spending has not begun its recovery as the number of Canadian travellers returning from abroad was more than 90% below pre-pandemic levels.
Moreover, the data from October may represent a short term peak in the sector, as shutdowns occurred in many parts of Canada in November and December to combat the pandemic. It is not likely that we will see how the second wave of COVID-19 has impacted the economy until the release of data for December 2020 or January 2021 at the earliest.
Three subsectors make large gains
The machinery, equipment and supplies, motor vehicle and motor vehicle parts and accessories, and building material and supplies subsectors all posted large gains, which led to the overall growth of the wholesale sector in October.
After declining in the two previous months, sales of machinery, equipment and supplies rose 3.6% to $13.8 billion in October on the strength of the computer and communications equipment industry which grew 11.2% for the month. The machinery, equipment and supplies subsector has been unlike most of the other wholesale subsectors since the pandemic. It quickly regained sales lost during COVID-19’s first wave, rebounding to February levels by July. Sharp declines in August and September have been partially offset by October’s growth. The lack of clear direction in the subsector is not surprising given its diversity. The subsector comprises sales of everything from cell phones and personal computers, to farm equipment, to industrial and oil and gas machinery. The varied impacts of COVID-19 on the industries served by the subsector led to its overall instability.
Sales of motor vehicles and motor vehicle parts and accessories continued to strengthen, up 3.1% to $11.3 billion, the largest increase since July. Six months after the pandemic generated a 74.0% drop in sales from February to April, sales in the subsector reached 96.8% of pre-COVID-19 levels in October. The recovery of the motor vehicle and motor vehicle parts and accessories subsector from the pandemic has been noticeably different than the recovery from the 2008/2009 recession. From September 2008 to January 2009, sales in the subsector fell 31.9%. It then took 10 months for the subsector’s sales to return to 96.8% of pre-recession levels. So while it is true that the motor vehicle and motor vehicle parts and accessories subsector has been the slowest to recover, it is still recovering much more quickly than after the 2008/2009 recession.
Sales of building material and supplies rose for the fifth time in the past six months, up 2.1% to $10.0 billion. Sales in all industries rose in October, with the largest gain coming in the lumber and other building supplies industry.
Partially offsetting the gains in October were lower sales of food, beverage and tobacco, and personal and household goods. Sales in the food, beverage and tobacco subsector fell for the third time in the past four months, down 1.8% to $12.2 billion. Almost all of the decline came from lower food sales. Personal and household goods sales declined 1.5% in October, reflecting a 6.2% drop in sales of pharmaceuticals and pharmacy supplies.
Higher sales in seven provinces
Sales increased in seven provinces in October, with Ontario and Saskatchewan leading the gains and Quebec posting the largest decline.
Sales in Ontario rose 1.7% to $34.7 billion, posting its second straight month of growth. Higher sales were recorded in five of the seven subsectors, led by increases in the motor vehicle and motor vehicle parts and accessories subsector (+5.5% to $7.8 billion), and the machinery, equipment and supplies subsector (+3.8% to $7.2 billion). The increase in sales of machinery, equipment and supplies comes after two months of declines in the subsector, and reflects growth in the computer and communications equipment and supplies industry.
Wholesale sales in Saskatchewan rose 6.7% to $2.4 billion in October following two consecutive declines. Higher sales were recorded in four of the seven subsectors. The miscellaneous subsector led the increase, up 12.3% to $1.1 billion for October. It was the highest level recorded for the subsector since February 2019.
According to data for Quebec, sales dropped by 2.0% to $12.5 billion after recording five consecutive months of growth. Lower sales were recorded in five of the seven subsectors, led by a decrease (-7.5% to $2.9 billion) in the food, beverage and tobacco subsector. The decrease in October brought the food, beverage and tobacco subsector to its lowest level since October 2019. Growth in the machinery, equipment and supplies subsector helped to dampen the decline in sales for Quebec, as it was up 8.3% to $2.1 billion with all four industries within the subsector posting gains in October.
Inventory declines in October
After two consecutive months of increasing inventories, wholesale inventories decreased by 0.6% to $90.1 billion for October.
Inventories in the motor vehicle and motor vehicle parts and accessories subsector decreased by 2.7% to $11.3 billion. It was the fourth consecutive month of declining inventories in the subsector and the lowest level reached since August 2016. The motor vehicle industry was responsible for the majority of the decrease in inventory in this subsector, as it recorded a drop of 4.2% to $6.7 billion.
Inventories decreased by 1.9% in the miscellaneous subsector to $11.6 billion. These decreases were predominantly associated with declines in the chemical products industry (-8.7% to $1.4 billion) and agricultural supplies industry (-2.0% to $4.8 billion). This was the fourth straight decline in inventories for the subsector after it reached an all-time high in June 2020.
The inventory-to-sales ratio decreased to 1.35 for October after three straight months of the ratio holding steady at 1.37. The ratio has not reached this level since June 2018. The inventory-to-sales ratio is a measure of the time (in months) required to exhaust inventories if sales were to remain at their current level.
Early estimates from the 2019 Annual Wholesale Trade Survey
Due to the COVID-19 situation, data from the Annual Wholesale Trade Survey will be published in March 2021 rather than December 2020 as initially planned. Since preliminary estimates are already available and being currently processed and analyzed prior to their release, this article includes an early indication of some key figures. Final numbers will be released on March 30, 2021.
The operating revenue of Canadian wholesalers increased 2.3% in 2019, reaching an all-time high of $1.1 trillion.
Wholesalers of petroleum products accounted for the largest proportion of operating revenue in the wholesale trade sector, with 24.6% of total operating revenue, despite being down 1.4% to $281.3 billion. During that time, the Raw Materials Price Index for conventional crude oil fell by 4.5%. This was partially offset by a 1.6% increase in the production of crude oil. Excluding petroleum, the wholesale trade sector saw revenues increase by 3.6% on the year.
Farm product wholesalers reported total operating revenue of $44.7 billion in 2019, up 4.4% from 2018. Oilseed and grain wholesalers accounted for approximately 80% of the growth in this subsector, with an increase in operating revenue of 4.7% to $33.7 billion. Most of the rest of the growth in this subsector was attributable to other farm product wholesalers, which added $308.1 million to operating revenue in 2019—a 7.5% increase over 2018 to reach $4.4 billion. The second largest industry within this subsector was live animal wholesalers, which saw a slight increase in operating revenue (+0.3%) in 2019 to reach $5.4 billion. The smallest industry within this subsector, nursery stock and plant wholesalers, reported a 4.2% increase in operating revenue in 2019 to reach $1.2 billion.
Source: Statistics Canada, www150.statcan.gc.ca/n1/daily-quotidien/201216/dq201216c-eng.htm


