Monthly Survey of Manufacturing, August 2023
October 16, 2023
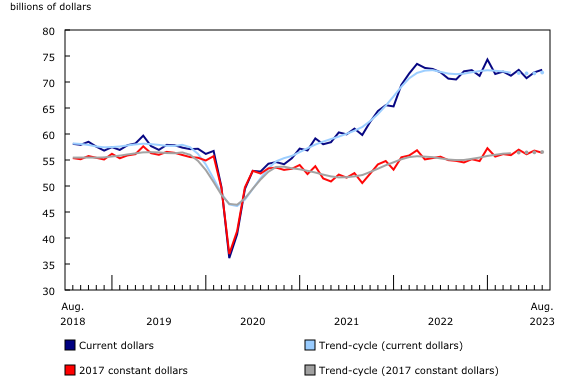
Canadian manufacturing sales rose 0.7% to $72.4 billion in August on higher sales in 9 of 21 subsectors, led by the petroleum and coal (+10.5%), food (+1.5%) and machinery (+2.4%) subsectors. This was the second consecutive monthly increase. Meanwhile, sales of fabricated metals (-3.5%) and miscellaneous (-9.4%) declined the most in August.
The monthly increase was due mostly to higher prices as sales in real terms decreased in August (-0.7%). The Industrial Product Price Index rose 1.3%.
Chart 1
Manufacturing sales
Impacts of the port strike on manufacturing activities
The impact of the port strike in British Columbia on the manufacturing sector was smaller in August compared with July. At the national level, 8.4% of manufacturing plants reported that their manufacturing activities were impacted by the strike in August, mainly through shortages of raw materials (5.0%) and transportation disruptions (3.7%).
Petroleum and coal subsector posts the largest increase
Sales of petroleum and coal products rose for the second consecutive month, up 10.5% to $8.4 billion in August, on higher volumes and prices. Sales in constant dollar terms increased 1.7% in August, while prices of refined petroleum energy product (including liquid biofuels) rose 10.6%. Concerns over continuing oil production cuts by the Organization of the Petroleum Exporting Countries and its partners (OPEC+) resulted in increased prices of petroleum products. Exports of refined petroleum energy products also saw a substantial growth, up 23.1% in August. Despite the monthly increase, sales of petroleum and coal products in current dollars were down 13.5% on a yearly basis in August.
Sales of food products rose 1.5% to $12.6 billion in August, the highest level on record. Excluding the seafood product preparation and packaging industry group, sales increased in all the food industry groups, led by bakeries and tortilla (+14.1%) and meat products (+5.2%). Both higher demand and prices of bakeries and tortilla products (+1.5%) and meat products (+1.8%) were responsible for the increases in sales. In constant dollar terms, sales of food increased 0.9% in August from the previous month, while year over year, sales in current dollar terms were up 4.6%.
Sales in the machinery subsector increased 2.4% to a record high, reaching $4.8 billion in August, mainly on higher sales of industrial machinery (+32.8%). Exports of industrial machinery, equipment and parts rose 1.2% accordingly. On a year-over-year basis, sales of machinery were up 15.1% in August.
Partially offsetting the monthly increases, sales of fabricated metal products declined 3.5% to $4.5 billion in August, following a 3.1% increase in July, with the August decline mainly driven by lower sales of other fabricated metal products as well as architectural and structural metals manufacturing. Despite the monthly decline, sales were 5.1% higher on a year-over-year basis in August.
Sales increase in seven provinces, led by Alberta and Manitoba
Manufacturing sales increased in seven provinces in August, led by Alberta (+6.0%) and Manitoba (+10.0%). Quebec (-1.8%) experienced the largest decrease.
In Alberta, sales rose for the second consecutive month, up 6.0% to $8.7 billion in August. The monthly increase was largely driven by higher sales of petroleum products (+16.4%), which also contributed significantly to higher total sales in Edmonton (+12.3%).
Sales in Manitoba rose 10.0% to $2.2 billion in August, following a 12.1% decline in July. Higher sales of chemical products, transportation equipment and food subsectors contributed the most to the gain. The transportation equipment and chemical subsectors were also mainly responsible for higher total sales in Winnipeg (+17.3%) in August.
Sales in Quebec fell 1.8% to $17.5 billion in August, on lower sales in 13 of 21 subsectors, led by the primary metal subsector (-11.0%). The decline in the subsector was partially attributable to lower prices of aluminum in August. Despite the monthly decline, total sales in Quebec were 3.0% higher on a yearly basis in August.
Total inventories edge down
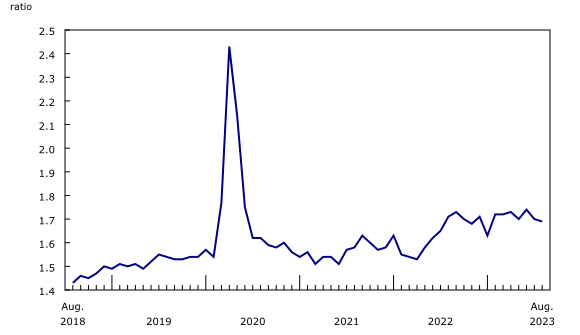
Total inventory levels edged down 0.1% to $122.2 billion in August, the lowest level since January 2023. The decline in August occurred because of lower raw materials (-0.6%) and finished products (-0.1%). Lower inventories of chemical products (-3.8%) and primary metals (-2.5%) were mainly responsible for the decline.
Chart 2
Inventory levels edge down
The inventory-to-sales ratio decreased from 1.70 in July to 1.69 in August. This ratio measures the time, in months, that would be required to exhaust inventories if sales were to remain at their current level.
Chart 3
The inventory-to-sales ratio decreases
Unfilled orders increase
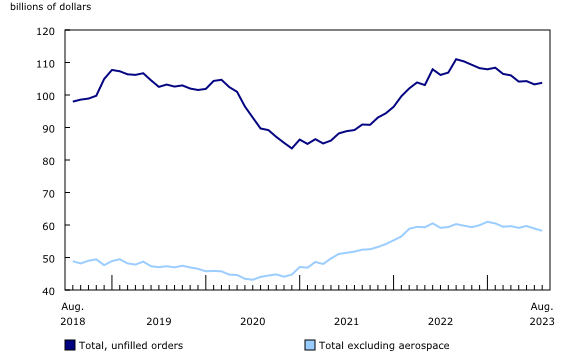
Unfilled orders rose 0.5% to $103.8 billion in August, largely on higher unfilled orders of aerospace product and parts (+2.7%). As recovery continues in the aerospace industry, driven by higher demand and market confidence, aerospace manufacturers face higher backlog orders which give them incentives to expand their manufacturing operations.
Chart 4
Unfilled orders increase
Capacity utilization rate increases
The capacity utilization rate (not seasonally adjusted) for the total manufacturing sector increased from 77.6% in July to 80.2% in August, on higher production. The gains in the capacity utilization rates were noticeable in the transportation equipment (+4.8 percentage points), petroleum and coal (+2.0 percentage points), and machinery (+5.8 percentage points) subsectors. The capacity utilization rate of primary metal manufacturing declined 1.0 percentage point in August.
Chart 5
The capacity utilization rate increases
Annual Survey of Manufacturing Industries preliminary estimates for 2022
A few preliminary 2022 estimates from the Annual Survey of Manufacturing Industries are available and indicate that revenue of goods manufactured has increased 17.1% from 2021. Total revenue is estimated at $923.7 billion, while revenue from goods manufactured reached $866.3 billion and total expenses grew to $827.4 billion.
Note that these advance preliminary estimates will be revised with the upcoming official release of the Annual Survey of Manufacturing Industries. For information on why the Annual Survey of Manufacturing Industries estimates may differ from the Monthly Survey of Manufacturing, please consult the webpage Differences between the Annual Survey of Manufacturing Industries and the Monthly Survey of Manufacturing.

