New House Prices Up 0.1% in December

February 13, 2017
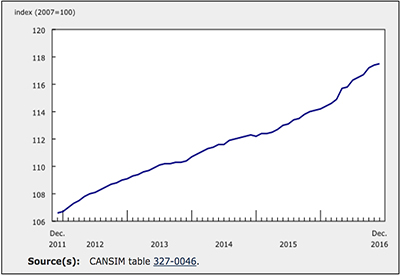
The New Housing Price Index (NHPI) edged up 0.1% in December compared with the previous month, largely reflecting price increases in Ontario and Alberta. Prices have risen at the national level for 21 consecutive months.
Among the 21 census metropolitan areas (CMAs) surveyed, new housing prices were up in 10, down in 1 and unchanged in 10.
Kitchener-Cambridge-Waterloo (+0.8%) and St. Catharines–Niagara (+0.8%) recorded the largest price gains among the CMAs covered by the survey. Builders in Kitchener-Cambridge-Waterloo reported higher construction costs, a shortage of developed land, and improving market conditions as reasons for the increase. In St. Catharines-Niagara, builders attributed the price increase to improving market conditions and moving to new phases of building with higher land development costs.
Prices rose 0.3% in Ottawa-Gatineau, Hamilton, Regina and Saskatoon. Builders in Ottawa-Gatineau cited market conditions and new phases of development as reasons for the gain. Builders in Hamilton reported improving market conditions and new phases of land development as reasons for higher prices.
In Regina, builders attributed the price increase to higher construction costs, while builders in Saskatoon pointed to market conditions as the primary driver for the rise.
New housing prices were unchanged in the combined region of Toronto and Oshawa after 22 consecutive monthly price increases.
New housing prices were down 0.1% in London. Builders identified lower negotiated selling prices as the main reason for the decline.
New Housing Price Index, 12-month change
The NHPI increased 3.0% over the 12-month period ending in December, reflecting gains in 16 of the CMAs surveyed. The combined metropolitan region of Toronto and Oshawa (+8.0%) was the top contributor to the gain, recording the largest 12-month price increase among the CMAs surveyed.
Other notable year-over-year gains were observed in St. Catharines-Niagara (+5.7%), Victoria (+5.1%) and Windsor (+4.8%).
In December, five metropolitan areas recorded year-over-year price declines, with Saskatoon (-1.4%) posting the largest year-over-year decrease.
The evolution of new housing prices in Canada
As 2017 marks the 150th anniversary of Confederation, we took a look back at an aspect of new housing price movements in Canada.
Prior to the recession of the early 1990s, real estate speculation, growth in immigration and favourable interest rates contributed to upward pressure on prices for new housing. In March 1989, the NHPI at the Canada level posted a record year-over-year increase of 16.6%. Price gains were reported in 19 of the 20 metropolitan areas surveyed, led by the combined metropolitan region of Toronto and Oshawa (+32.7%) and Vancouver (+14.2%).
Following the March 1989 peak, the NHPI rose year over year at an increasingly slower rate for 16 consecutive months. Following no price change in August 1990, the NHPI posted year-over-year price declines for 17 consecutive months.
Source: Statistics Canada, www.statcan.gc.ca/daily-quotidien/170209/dq170209a-eng.htm.


