Monthly Survey of Manufacturing: Sales Continue Rising
Ontario wins in the transportation segment are a solid opportunity for the electrical market. With one of the largest concentrations of car and related transportation manufacturing in North America, the drivers to accelerate the purchase of electrical equipment and electrical retrofit are there. As well, positive news in machine tool orders generate related equipment sales in motor control, power and distribution equipment. With the fourth gain in 11 months, this sign is a solid indicator the future is getting a little more predictable. Take a close look at these figures.
Monthly Survey of Manufacturing: Sales Continue Rising
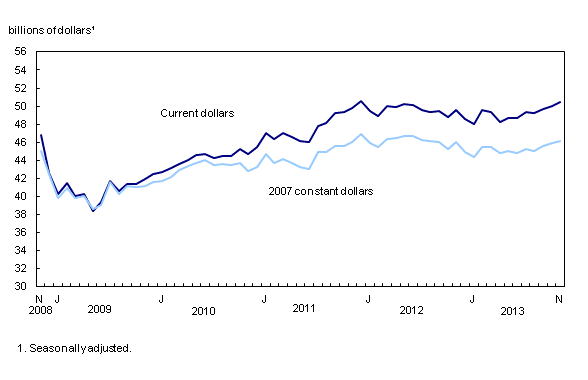
Manufacturing sales increased 1.0% in November to $50.5 billion, the sixth advance in seven months. With the latest rise, sales were at their highest level since December 2011. The increase in November largely reflected gains in the transportation equipment and machinery industries.
Sales advanced in 11 of 21 industries, representing about 58% of manufacturing. For durable goods, sales rose 2.9% to $25.6 billion. Sales declined 0.9% on the non-durable goods side of manufacturing.
Constant dollar manufacturing sales increased 0.7% in November, indicating a rise in the volume of goods sold.
Transportation equipment and machinery sales rise
Sales in the transportation equipment industry rose 6.1% to $9.5 billion, mostly as a result of gains in the aerospace product and parts as well as the motor vehicle industries.
In the aerospace industry, production rose 21.3% to $1.8 billion. An increase of this magnitude is not unusual for the industry, as aerospace production is substantially more volatile than the manufacturing sector as a whole.
Motor vehicle sales increased 5.0% to $4.8 billion, the highest level since November 2007. Since reaching a low of $1.6 billion in January 2009, sales in this industry have generally been on the rise. As a result, the motor vehicle industry comprised 9.6% of total Canadian manufacturing in November. By contrast, in January 2009, within the context of the last recession, the share of motor vehicle sales out of total manufacturing sales was 4.0%.
In the machinery industry, sales increased 5.4% to $3.0 billion, the fourth gain in 11 months.
Declines in the food and chemical industries offset a portion of these increases. Sales in the food industry were down 1.5% to $7.5 billion while chemical sales decreased 2.3% to $3.9 billion.
Chart 1: Manufacturing sales increase
In November, seven provinces posted higher sales with Ontario leading the gains.
Sales in Ontario increased 2.2% to $23.0 billion, largely as a result of gains in the transportation equipment industry. Motor vehicle sales were up 5.5% while aerospace production rose 44.9%. The increase in aerospace followed a 32.7% decline in October. The primary metal and machinery industries also contributed to the overall provincial advance.
In Newfoundland and Labrador, sales rose 33.1% to $559 million in November. Although large, this gain is not unprecedented. Sales for Newfoundland and Labrador tend to have greater volatility than the other provinces. The change in November, for example, is comparable in magnitude to a 31.4% rise in March 2013 and a 34.1% drop in February 2013.
Sales in BC’s manufacturing sector rose 2.7% to $3.5 billion, the fifth consecutive monthly advance. In November, 14 of 21 industries posted higher sales in the province, primarily on the durable goods side of the sector. The primary metal, wood product and machinery industries led the gains.
The overall advance in national sales was partly offset by declines in New Brunswick and Quebec. New Brunswick manufacturing sales fell 8.9% to $1.8 billion in November, reflecting lower sales of non-durable goods. Sales by Quebec manufacturers were down 1.2% to $11.6 billion, reflecting decreases in 15 of 21 industries. In Quebec, petroleum and coal products as well as food industries posted the largest declines.
Chart 2: Inventories edge upwards
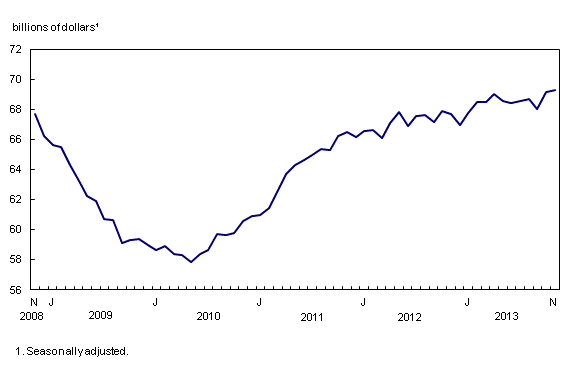
Inventories rose 0.2% to $69.3 billion in November. An increase in the aerospace product and parts industry was partly offset by a decline in petroleum and coal product inventories. In constant dollar terms, total inventories edged up 0.1%, indicating that the volume of inventories held by manufacturers was basically unchanged. In the aerospace product and parts industry, inventories rose 2.9% to $7.8 billion. Almost all of the gain stemmed from higher goods-in-process. Inventories of petroleum and coal products declined 1.4% to $5.9 billion, reflecting lower raw materials on hand.
Chart 3: Inventory-to-sales ratio declines
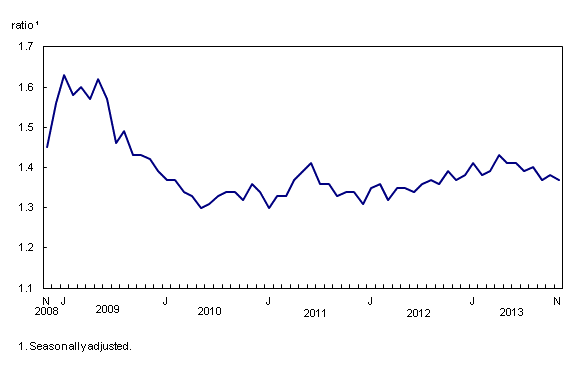
The inventory-to-sales ratio declined from 1.38 in October to 1.37 in November. Although inventories were up slightly, the decline reflected the fact that the total rise in manufacturing sales was greater than the increase in inventories.
Chart 4: Unfilled orders rise
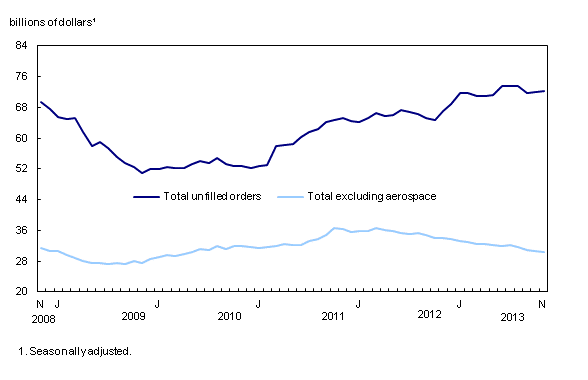
Unfilled orders increased 0.4% to $72.2 billion in November. The rise stemmed from higher unfilled orders in the aerospace product and parts industry. Excluding the aerospace industry, unfilled orders were down 0.8%. The primary metal, electrical equipment, and computer and electronic product industries posted the largest declines.
In the aerospace industry, unfilled orders were up 1.3% to $41.9 billion. The increase was the eighth in 11 months and reflected the strengthening of the US dollar relative to the Canadian dollar. The majority of unfilled orders in this industry are held in US dollars.
In the primary metal industry, unfilled orders were down 6.3% to $1.4 billion, the first decline following six months of gains. Decreases in November were widespread in the industry. Lower unfilled orders were also posted by the electrical equipment (-3.7%) and the computer and electronic product (-2.2%) industries.
New orders rose 1.2% to $50.8 billion as a result of increases in the machinery, aerospace product and parts as well as the motor vehicle industries.
Monthly data in this release are seasonally adjusted and are expressed in current dollars unless otherwise specified.
Source: Statistics Canada http://www.statcan.gc.ca/daily-quotidien/140121/dq140121a-eng.htm

