Manufacturing Sales Dipped 1.3% in July

Sept 25, 2019
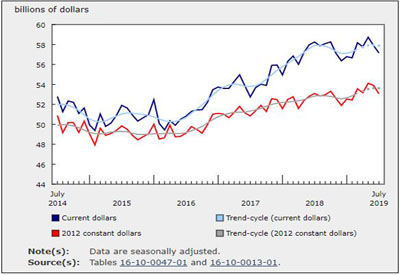
Manufacturing sales decreased 1.3% to $57.2 billion in July, following a 1.4% decline in June.
Sales were down in 11 industries in July, representing 66.8% of total manufacturing sales. The decline in July was mainly due to lower sales in the primary metal and motor vehicle industries. The food industry posted the largest gain.
Manufacturing sales in constant dollars were down 1.6% in July, indicating that a lower volume of manufacturing products was sold.
Sales down in the primary metal industry
Sales in the primary metal industry fell 7.3% in July following a 10.6% increase in June. In constant dollars, sales of primary metals were down 7.0%. Every primary metal industry except alumina and aluminum production and processing reported lower sales. In particular, sales of iron and steel mills and ferro-alloy products decreased 14.8% due to lower quantities sold and maintenance shutdowns at some plants.
Sales of motor vehicles decreased 4.7% in July, the second consecutive monthly decline. The decrease in motor vehicle sales was partially the result of an extended shutdown at a major assembly plant attributable to maintenance projects to support new model production. Sales of motor vehicles were nevertheless 1.0% higher than in July 2018.
Sales were also down in the fabricated metal product (-3.2%), railroad rolling stock (-26.7%), and computer and electronic product (-6.0%) industries.
Sales in the food industry increased 1.3% in July after two consecutive monthly declines. In volume terms, sales rose 1.9%. The growth in food manufacturing reflected higher sales of meat products in Quebec, Alberta and Ontario. The seafood industry posted an unadjusted sales decline, which is expected as fishing season is ending.
Ontario posts the largest decrease
Sales were down in five provinces in July, led by Ontario and Alberta. Nova Scotia reported the largest gain.
Following two consecutive monthly gains, sales in Ontario fell 1.5% to $26.5 billion in July. The decline stemmed from lower sales of primary metals (-13.4%) and motor vehicles (-4.7%).
In Alberta, sales were down 2.8% to $6.3 billion, following a 7.0% decrease in June. In July, 15 of 21 manufacturing industries reported lower sales in Alberta, led by the petroleum and coal product industry (-5.0%).
Manufacturing sales in Quebec declined 1.2% to $14.2 billion in July. The decrease was attributable to lower sales in the transportation equipment (-5.3%) and primary metals (-4.0%) industries.
Sales in Nova Scotia rose 5.4% to $801 million as a result of gains in the paper, food and transportation equipment industries.
Manufacturing sales now available by select census metropolitan area
With this release, Statistics Canada is publishing manufacturing sales data for 12 census metropolitan areas (CMAs) for the first time. The data cover the period from January 2009 to July 2019. More information can be found under the “Related information” tab of the Monthly Survey of Manufacturing release. The local manufacturing data are not seasonally adjusted.
In July, sales declined 7.6% (unadjusted) in Toronto to $9.9 billion, largely reflecting lower motor vehicle sales. Motor vehicle manufacturers typically shut down for a portion of the month to undertake maintenance work.
Montréal’s manufacturing sector was down 3.1% (unadjusted) to $6.4 billion in July. The decline reflected lower production in the aerospace product and parts industry. In contrast to Montréal, sales in the CMA of Québec rose 1.7%.
Manufacturing sales in Edmonton were down 0.3% to $3.3 billion on an unadjusted basis while sales in Calgary rose 4.5% to $1.1 billion.
Inventory levels rise again following a decline in June
Total manufacturing inventories rose 0.3% to $88.3 billion in July, following a 1.3% decline in June. Inventory levels have been on an upward trend since January 2017, decreasing four times over that period.
Inventories were up in 12 of 21 industries in July, led by the transportation equipment (+2.1%) and chemical (+1.7%) industries. The gains were partly offset by a 2.3% decrease in fabricated metal products inventory.
The inventory-to-sales ratio rose from 1.52 in June to 1.54 in July, due to lower sales and higher inventories. This ratio measures the time, in months, that would be required to exhaust inventories if sales were to remain at their current level.
Unfilled orders decline
Unfilled orders fell 1.4% to $98.1 billion in July as a result of lower unfilled orders in the transportation equipment (-1.4%) and the fabricated metal product (-5.6%) industries. Unfilled orders rose in the chemical (+27.3%) and computer and electronic product (+1.4%) industries.
Following a 4.4% decrease in June, new orders fell 1.6% to $55.8 billion in July as a result of lower new orders in the transportation equipment (-5.5%) and fabricated metal product (-14.9%) industries.
Capacity utilization rate declines
The capacity utilization rate (not seasonally adjusted) for the total manufacturing sector declined 4.0 percentage points, from 81.3% in June to 77.3% in July. Overall, 16 of 21 industries posted a lower capacity utilization rate in July.
In the transportation equipment industry, the capacity utilization rate fell 16.6 percentage points, mainly because of shutdowns in July. Despite the widespread declines, the capacity utilization rate rose 2.6 percentage points in the petroleum and coal industry, mainly on the strength of increased refinery production, following three consecutive declines from April to June 2019.
Source: Statistics Canada, www150.statcan.gc.ca/n1/daily-quotidien/190917/dq190917a-eng.htm


