GDP Rose 0.6% YOY in Q4 2016
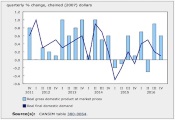
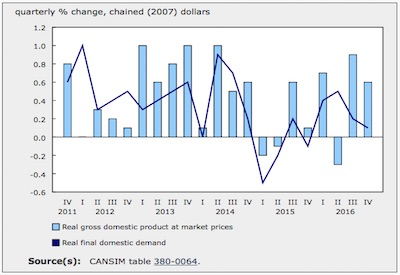
Real gross domestic product (GDP) rose 0.6% in the fourth quarter, following a 0.9% increase in the third quarter. Final domestic demand continued to decelerate (+0.1%), with ongoing weakness in business investment.
Household final consumption expenditure grew 0.6%, a slightly slower pace than the previous quarter (+0.7%). Growth was driven by higher outlays on durable goods (+2.0%) and financial services such as mutual funds and stock and bond commissions (+1.6%). Investment in housing increased 1.2%.
Exports rose 0.3%, following a 2.3% gain in the third quarter. Exports of both goods (+0.3%) and services (+0.5%) increased. Imports of goods fell 4.1%, leading to a 3.5% drop in overall imports. Some of this decline was attributable to the one-time import of a large module destined for the Hebron offshore oil project in the third quarter.
Business gross fixed capital formation decreased 2.1%, following a 0.5% decline in the third quarter. Business investment in non-residential structures fell 5.9% following the strong growth in the third quarter (+3.5%), partly due to a large one-time investment in the Hebron offshore oil project. Investment in machinery and equipment (-2.7%) and intellectual property products (-1.9%) was also down.
Businesses reduced their inventories by $5.0 billion in the fourth quarter, after accumulating $7.4 billion in the third quarter. Manufacturing inventories were drawn down by $6.9 billion. Retail inventories of motor vehicles were reduced by $1.9 billion, as household purchases of vehicles increased 1.5% and imports of passenger cars and light trucks fell 6.0%.
Expressed at an annualized rate, real GDP rose 2.6% in the fourth quarter. In comparison, real GDP in the United States grew 1.9%.
Housing market rebounds
Business investment in residential structures rebounded 1.2% following two weak quarters. New construction investment (+1.9%) was the main driver in the fourth quarter, while renovation activity (+1.7%) also showed strength. Ownership transfer costs declined 1.0%, in contrast to the strength in the resale market evidenced earlier in the year.
Business investment continues to decline
Business gross fixed capital formation decreased 2.1% in the fourth quarter, the ninth consecutive quarterly decline. As a result, final domestic demand (+0.1%) decelerated for a second consecutive quarter.
Business investment in non-residential structures fell 5.9%, following a 3.5% gain in the previous quarter. Investment in engineering structures (-7.3%) reversed the strong growth in the third quarter (+5.3%), which was partially due to the delivery of the Hebron oil platform.
Businesses reduced investment in intellectual property products (-1.9%), following a 4.5% drop in the third quarter. Mineral exploration and evaluation (-21.0%) fell at a similar rate to the third quarter, mainly due to lower exploration activity in the oil and gas sector. Investment in software increased 0.4%, while research and development was flat.
Investment in machinery and equipment decreased 2.7%, driven by a decline in industrial machinery and equipment (-7.4%). Investment in aircraft and other transportation equipment grew 14.0%.
Inventories drawn down
Businesses drew down their inventories by $5.0 billion in the fourth quarter, after accumulating $7.4 billion in the third quarter.
Non-farm inventories were reduced by $4.8 billion. Manufacturing inventories were drawn down by $6.9 billion, with stocks of durable goods decreasing by $7.0 billion, while non-durable goods rose by $151 million. Retail inventories were drawn down $1.4 billion, mainly by a $1.9 billion reduction in motor vehicle stocks. Wholesalers added $3.2 billion to the stock of durable goods and $1.0 billion to non-durable goods.
Farm inventories were down $259 million in the fourth quarter, following large accumulations in the second (+$1.1 billion) and third (+$1.2 billion) quarters.
The economy-wide stock-to-sales ratio edged down from 0.748 in the third quarter to 0.745 in the fourth quarter.
Gross operating surplus increases, boosted by higher export prices
The gross operating surplus of non-financial corporations expanded 3.5%, following a similar increase in the third quarter. Gross operating surplus of financial corporations increased 3.9%.
Higher export prices and an inventory draw down contributed to higher non-financial corporate earnings. Export prices of energy products, metal ores and non-metallic minerals increased in the fourth quarter.
The terms of trade (+1.9%), measured as export prices relative to import prices, improved for the third consecutive quarter, while real gross national income rose 1.3%.
Annual 2016
Real GDP rose 1.4% in 2016, following more modest growth in 2015 (+0.9%). Final domestic demand grew 0.9%, following a 0.3% increase the previous year. Driven by household consumption expenditure, much of this growth occurred in the first two quarters with a deceleration towards the end of the year. Household consumption expenditure grew 2.2% following a 1.9% gain in 2015. Outlays on both goods (+2.7%) and services (+1.9%) rose.
Also contributing to the annual gain was a 2.0% increase in government final consumption expenditure, an acceleration from the 1.5% growth in 2015.
Annual growth in 2016 was pulled down by lower business investment in non-residential structures, which posted a double-digit decline (-10.7%) for a second consecutive year, mainly due to weakness in the energy sector.
In contrast, housing investment increased 2.9% for the year. Ownership transfer costs (+7.6%) and investment in new construction (+2.3%) and renovations (+0.7%) all contributed to the increase.
Exports of goods and services increased 1.1% in 2016, despite some fluctuations throughout the year. Exports of services grew 4.0%, while goods rose 0.5%. Imports declined 1.0% in 2016, driven by lower imports of goods (-1.3%). Imports of services (+0.2%) rose slightly.
Real gross domestic income rose 0.7% in 2016, following a 1.4% decrease in 2015. Following a 6.9% drop in 2015, the terms of trade declined 2.1% as import prices rose 1.3% while export prices fell 0.9%. The implicit price of GDP grew 0.6% after falling 0.8% in 2015.
Household disposable income grew 3.8%, led by a 2.5% increase in compensation of employees. This outpaced the growth in household final consumption expenditure (+3.2% in nominal terms), bumping up the household saving rate slightly, from 5.0% in 2015 to 5.3% in 2016.
Source: Statistics Canada, http://www.statcan.gc.ca/daily-quotidien/170302/dq170302a-eng.htm.

