GDP of Environmental and Clean Tech Products Sector Grew 0.8% in 2018

Mar 16, 2020
The gross domestic product (GDP) generated by the environmental and clean technology (ECT) products sector grew 0.8% in real (volume) terms from 2017 to 2018. By comparison, the total Canadian economy grew 2.2% over the same period. The clean technology products component of GDP from this sector declined 1.0% from 2017 to 2018 — an increase in the growth of manufactured goods (+4.1%) did not offset a decrease in construction services (-5.2%) as large-scale projects were completed in 2018.
The Environmental and Clean Technology Products Economic Account measures the contribution to the Canadian economy of goods and services that reduce environmental impacts. Two broad categories of goods and services are recognized: environmental goods and services (including clean electricity, biofuels and primary goods, and waste management and remediation services), and clean technology goods and services (including manufactured goods, scientific and research and development services, construction services, and support services). Examples of clean technology goods and services include solar panels or the design and construction of energy-efficient buildings.
The overall growth of the ECT sector was moderated by a downturn related to the completion of the hydroelectric dam at Muskrat Falls in Newfoundland and Labrador.
British Columbia had the highest growth among the provinces in 2018, advancing 4.7% from the previous year, mainly as a result of growth in clean technology services. Alberta had the second-highest growth (+4.2%), led by increased production of clean energy. Newfoundland and Labrador and Nova Scotia both reported large decreases after construction on ECT-related hydroelectric projects ended in 2018.
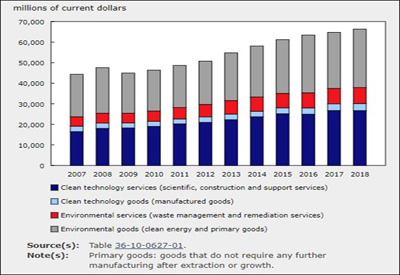
In nominal terms, the value of the total ECT products sector in Canada was $66.3 billion in 2018, accounting for 3.2% of Canadian GDP. This share has remained relatively stable since the start of the time series in 2007. Three provinces were the main contributors in 2018: Ontario (33.3%), Quebec (30.5%) and British Columbia (13.6%).
Gross domestic product from the environmental and clean technology products sector is driven by clean electricity production
In 2018, over half (54.6%) of the national GDP from ECT products was attributable to the value of environmental goods and services. Clean electricity was a large component of this category, accounting for 41.3% of GDP from ECT products. The remaining 45.4% of national GDP from ECT products was attributable to the production of clean technology goods and services.
Of the GDP from ECT products that was attributable to the generation of clean electricity in 2018, almost three-quarters was driven by the provinces of Quebec (43.6%) and Ontario (28.3%). Alberta, British Columbia and Ontario contributed the largest shares of the GDP from ECT that were attributable to biofuels and primary products (38.2%, 23.2% and 22.1%, respectively). The GDP from ECT products generated by manufactured goods was predominately driven by Ontario (43.9%), followed by Quebec (27.9%). More than half (57.6%) of the national contribution to the GDP from ECT that came from clean technology services was generated in Ontario (36.6%) and Quebec (21.1%).
International trade expands
Volumes of ECT product exports increased 1.1% from 2017 to 2018. In nominal terms, the value of Canadian ECT product exports totalled $13.6 billion in 2018, accounting for 1.9% of total Canadian exports. In 2018, 77.6% of all ECT product exports were clean technology products (mostly manufactured goods). Clean electricity exports accounted for 16.4% of ECT product exports. Ontario accounted for 48.8% of national ECT product exports, while Quebec accounted for 21.9%.
National import volumes of ECT products grew 20.1% in 2018, after decreasing 0.6% in 2017. The total value of Canadian ECT product imports (in nominal terms) was $19.5 billion in 2018, accounting for 2.6% of total Canadian imports. Clean technology products (mostly complex manufactured products) accounted for 77.4% of ECT product imports, followed by biofuels and primary goods, at 19.6%.
Employment increases
An estimated 317,000 jobs were attributable to total ECT activity in 2018, comprising 1.7% of all jobs in Canada. This represented a 1.6% increase from 2017. Just over 80,400 jobs were in the engineering construction industry (25.5% of all ECT jobs), followed by 69,900 jobs in the utilities industry.
Ontario, Quebec and British Columbia employed 76.1% of ECT sector workers in 2018.
In 2018, the national average annual compensation per ECT job, including benefits, was $84,700 (up 0.1% from 2017), compared with an economy-wide average of $61,700 (up 3.2% from 2017).
Source: Statistics Canada, www150.statcan.gc.ca/n1/daily-quotidien/200313/dq200313b-eng.htm


