GDP Grew 3% in July

Oct 7, 2020
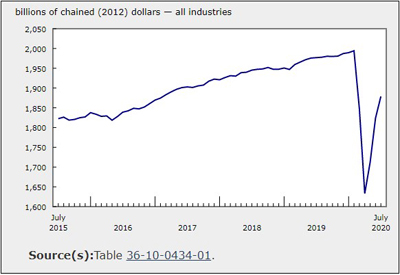
Real gross domestic product (GDP) grew 3.0% in July, following a 6.5% increase in June. The third consecutive monthly gain continued to offset the steepest drops experienced by Canadian economic activity in March and April, however overall economic activity was still about 6% below February’s pre-pandemic level.
All 20 industrial sectors posted increases in July as the agriculture, utilities, finance and insurance as well as real estate rental and leasing sectors surpassed their February pre-pandemic levels, joining retail trade which did so in June.
Given the unprecedented economic situation brought on by the COVID-19 pandemic and the demand for trusted information, Statistics Canada continues to provide an advanced aggregate indicator of the state of the Canadian economy. Preliminary information indicates an approximate 1% increase in real GDP for August. Overall, the economic recovery continued its course but at a more moderate pace than what was observed for the months of May to July. Most sectors continued their growth trajectory in August with the exceptions of retail trade and public administration which pulled back marginally. Owing to its preliminary nature, this estimate will be revised on October 30 with the release of the official GDP data for August.
Manufacturing continues to grow
The manufacturing sector grew 5.9% in July, following a 15.1% expansion in June, as many factories continued ramping up their production according to the Monthly Survey of Manufacturing. Despite the continued gains through July, manufacturing activity remained about 6% below February’s pre-pandemic level.
Durable manufacturing grew 5.7%, a third consecutive monthly gain, as 7 of the 10 subsectors increased in July. Contributing the most to the gain was a 16.6% jump in transportation equipment manufacturing as all industries, except for ship and boat building (-7.9%), were up. Motor vehicle (+10.5%) and motor vehicle parts manufacturing (+38.6%) continued scaling up production, following a pandemic-induced shutdown, to meet increased consumer demand. Fabricated metal product manufacturing (+4.7%) and furniture and related product manufacturing (+13.3%) also posted notable gains and were partly offset by declines in machinery manufacturing (-6.4%), computer and electronic product manufacturing (-4.5%) and wood products manufacturing (-0.9%).
Non-durable manufacturing was up 6.2% as output of all subsectors, with the exception of textile and textile product mills (-9.0%), increased. Plastic and rubber products (+17.9%) and chemical manufacturing (+6.0%) contributed most to the growth, along with a 6.3% increase in petroleum and coal product manufacturing.
The public sector increases
The public sector (educational services, health care and social assistance, and public administration) rose 2.5% in July, as all three components were up. The output of health care and social assistance rose 3.7%, led by a 7.8% increase in ambulatory health care services (services provided by offices of physicians, health practitioners, dentists, medical and diagnostic laboratories) attributable to the continued reopening of activity across the country. However this subsector’s output was still approximately 16% below its February pre-pandemic level, as many health care providers’ offices continued to operate at a reduced capacity, including restricting the number of appointments aimed at limiting the spread of COVID-19. Nursing and residential care facilities (+1.7%) and social assistance (+3.7%) were also up, while hospitals increased 0.9%. Public administration grew 0.9% and educational services rose 2.9%.
Accommodation and food services expands
Accommodation and food services jumped 20.1% in July, marking a third consecutive double-digit monthly increase on the heels of even larger declines in March and April. Activity at food services and drinking places rose 17.6% as establishments continued to reopen and customers got used to new rules and restrictions. As reported by the Food Services and Drinking Places survey, activity grew at all types of restaurants as well as bars, pubs and some nightclubs as summer and patio-season progressed.
Following a strong increase of activity in June, accommodation services grew 27.6% in July. Many Canadians opted for a closer-to-home vacation, in light of the varying sets of rules for interprovincial travel and continued international travel restrictions.
Regardless of strong increases over the last couple of months, output across both accommodation and food services remained approximately 43% and 29% below their respective pre-pandemic February levels.
Real estate and rental and leasing increase
Real estate and rental and leasing grew 1.9% in July. Activity at the offices of real estate agents and brokers (+30.6%) more than surpassed the pre-pandemic level in July, jumping to the highest point since March 2004, as home resale activity in the majority of urban centres continued double-digit increases.
Wholesale trade up
Wholesale trade grew 4.6% in July, as all nine subsectors expanded. The machinery, equipment and supplies wholesaling subsector (+6.0%) led the growth, as all industries’ output increased. Motor vehicle and motor vehicle parts and accessories (+14.7%) wholesaling was up, partly as a result of an increase in activity at motor vehicle and motor vehicle parts plants; personal and household goods wholesaling rose 5.8%.
Transportation and warehousing sector grows
The transportation and warehousing sector rose 5.7%, as all 10 subsectors were up. Leading the growth were support activities for transportation (+8.0%) and truck transportation (+3.8%). Urban transit systems (+48.0%) as well as taxi and limousine service (+9.2%) benefited from the continued reopening of the economy as ridership grew. Air transportation rose 55.5% in July, yet it remained nearly 92% below the January level before the COVID-19-related travel advisories began.
Professional services continue to grow
The professional services sector grew 2.8% in July, up for the third consecutive month, as all but one type of service grew. With the exception of declines in March and April, the sector has been continuously growing since November 2017. Management, scientific and technical consulting services led the growth in July with a 10.5% increase, while legal services, which derive much of their activity from real estate transactions, were up 5.4%. Advertising, public relations, and related services (+8.9%) and computer systems design and related services (+1.0%) were up, while accounting, tax preparation, bookkeeping and payroll services (-0.3%) offset some of the growth.
Other industries
Mining, quarrying, and oil and gas extraction increased 2.4% in July. Mining and quarrying (except oil and gas) rose 10.8%, primarily as a result of higher copper, nickel, lead and zinc mining (+35.4%) and potash mining (+44.9%) . Support activities for mining, and oil and gas extraction (+26.4%) were up for the first time in five months as all types of activities grew in July. Oil and gas extraction (-2.9%) decreased for the fourth time in five months as both oil sands extraction and oil and gas extraction (except oil sands) fell to levels last seen in the second half of 2017.
Utilities rose 3.5% in July following a 1.5% increase in June. Electric power generation, transmission and distribution was up 4.2%, as record-hot weather across many parts of the country increased electricity demand for cooling purposes. Natural gas distribution was down 1.1%.
Construction grew 0.6% in July as gains in residential (+2.4%) and repair (+2.5%) construction more than offset lower non-residential construction (-3.0%) and engineering and other construction (-0.5%).
Finance and insurance grew 1.0%, as gains in credit intermediation and monetary authorities (+1.1%) and insurance carriers and related activities (+1.7%) more than offset a decline in financial investment services, funds and other financial vehicles (-0.7%).
After surpassing the pre-pandemic levels of activity in June, retail trade edged up 0.4% in July as 7 of 12 subsectors were up. Leading the growth were clothing and clothing accessories stores (+11.2%), motor vehicle and parts dealers (+3.2%) and gasoline stations (+6.5%), while building material and garden equipment and supplies (-10.2%), sporting goods, hobby, book and music stores (-7.6%) and food and beverage stores (-1.2%) offset some of the growth.
Source: Statistics Canada, www150.statcan.gc.ca/n1/daily-quotidien/200930/dq200930a-eng.htm?CMP=mstatcan


