Labour Force Survey, March 2024 – Employment Shows Little Change
April 12, 2024
Employment was little changed in March (-2,200; -0.0%) and the employment rate fell 0.1 percentage points to 61.4%. The unemployment rate rose 0.3 percentage points to 6.1% in March. On a year-over-year basis, the unemployment rate was up by 1.0 percentage points. In March, employment declined among youth aged 15 to 24 (-28,000; -1.0%), while it rose among core-aged men (aged 25 to 54) (+20,000; +0.3%). Employment was little changed among core-aged women, as well as among women and men aged 55 and older.
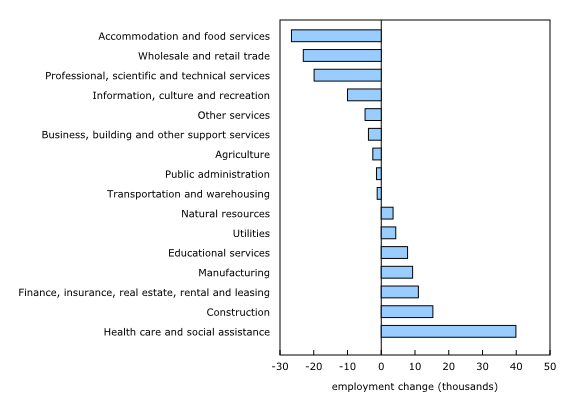
There were fewer people employed in accommodation and food services (-27,000; -2.4%), wholesale and retail trade (-23,000; -0.8%) and professional, scientific and technical services (-20,000; -1.0%) in March. Employment increased in four industries, led by health care and social assistance (+40,000; +1.5%).
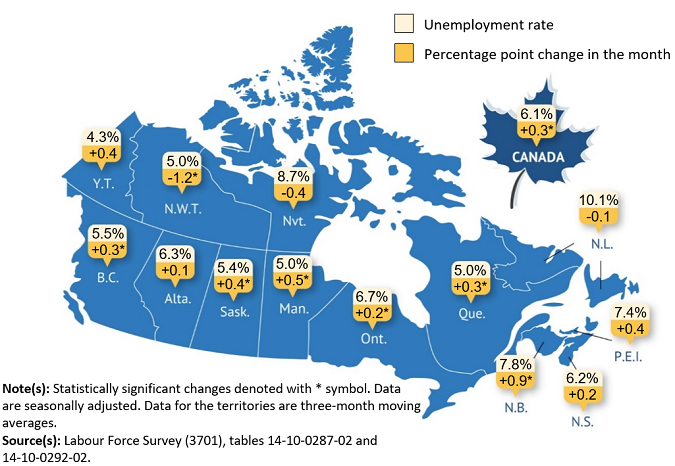
Employment decreased in Quebec (-18,000; -0.4%), Saskatchewan (-6,000; -1.0%) and Manitoba (-4,300; -0.6%) in March, while it increased in Ontario (+26,000; +0.3%).
Total hours worked in March were virtually unchanged in the month but were up 0.7% compared with 12 months earlier.
Average hourly wages among employees rose 5.1% (+$1.69 to $34.81) on a year-over-year basis in March, following growth of 5.0% in February (not seasonally adjusted).
Employment rate falls for sixth consecutive month
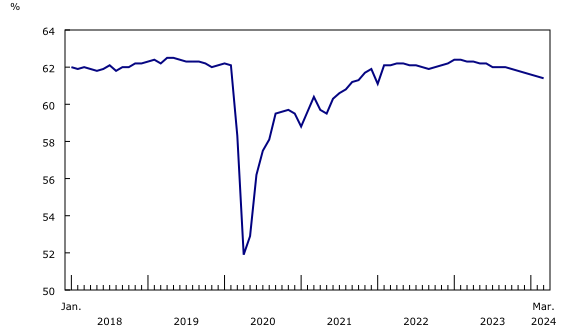
Employment was virtually unchanged in March (-2,200; -0.0%), following increases in February (+41,000; +0.2%) and January (+37,000; +0.2%). The employment rate—the proportion of the population aged 15 and older who are employed—declined by 0.1 percentage points to 61.4% in March, the sixth consecutive monthly decrease.
From March 2023 to March 2024, the employment rate has decreased by 0.9 percentage points, as employment growth (+324,000; +1.6%) has been outpaced by growth in the population aged 15 and older in the Labour Force Survey (LFS) (+1.0 million; +3.2%). On March 27, 2024, Statistics Canada reported that Canada’s population had increased at an annual rate of 3.2% as of January 1, 2024, the fastest annual growth rate since 1957.
Private sector employment was little changed for a fourth consecutive month in March and has held steady for eight of the nine months since June 2023. Public sector employment was also little changed in March 2024. From March 2023 to March 2024, employment has grown at a faster rate in the public sector (+4.8%; +202,000) than in the private sector (+1.1%; +141,000).
Self-employment fell by 29,000 (-1.1%) in March, partly offsetting an increase of 38,000 (+1.5%) in February. On a year-over-year basis, self-employment was little changed in March.
Chart 1
Employment rate down for sixth consecutive month in March
Employment declines among youth, increases among core-aged men
Employment among youth aged 15 to 24 fell by 28,000 (-1.0%) in March, continuing a trend which has seen virtually no net employment growth among youth since December 2022.
The youth employment rate fell 0.9 percentage points to 55.0% in March 2024, the lowest level since February 2012, outside of 2020 and 2021, during the COVID-19 pandemic.
The employment rate has trended down for both male and female youth over the past 12 months, falling by 4.8 percentage points to 55.5% for young women in March 2024, and by 4.0 percentage points to 54.6% for young men. The employment rate has followed a similar 12-month trend for students aged 15 to 24 (-4.2 percentage points to 39.3%) and non-students in the same age group (-3.2 percentage points to 75.0%) (not seasonally adjusted).
Among core-aged men, employment rose by 20,000 (+0.3%) in March, following a similar-sized increase in February (+23,000). The employment rate for core-aged men was 87.2% for the third consecutive month, but was down 0.6 percentage points from 12 months earlier. The employment rate for core-aged men in March remained higher than the average of 86.5% observed from 2017 to 2019.
Among core-aged women, employment was virtually unchanged in March 2024, and the employment rate was little changed at 81.3%. The employment rate for core-aged women has generally trended down from the record high of 82.0% observed in both January and March 2023, but remained above the average observed from 2017 to 2019 (79.3%).
In March 2024, employment held steady for both women and men aged 55 and older. The employment rate in this age group was 30.1% for women (down 0.6 percentage points on a year-over-year basis) and 40.0% for men (little changed on a year-over-year basis).
Unemployment rate rises to 6.1%
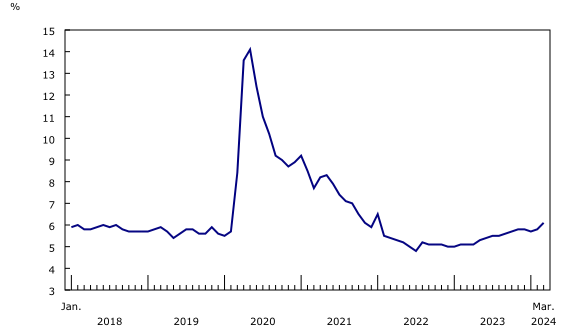
The unemployment rate rose 0.3 percentage points to 6.1% in March, bringing the cumulative increase over the past 12 months to 1.0 percentage points.
The monthly increase in the unemployment rate in March was driven by an increase of 60,000 (+4.8%) people searching for work or on temporary layoff. This brought the total number of unemployed people to 1.3 million, an increase of 247,000 (+23.0%) compared with 12 months earlier.
The majority (64.9%) of people who were unemployed in February 2024 remained unemployed in March 2024. This was higher than the corresponding proportion for February and March 2023 (60.5%), indicating that unemployed persons may have faced greater difficulties finding work compared with a year earlier.
The labour force participation rate—the proportion of the population aged 15 and older who were employed or looking for work—stood at 65.3% for the third consecutive month in March 2024. On a year-over-year basis, the participation rate was down by 0.4 percentage points, largely reflecting year-over-year declines in the participation rates of youth aged 15 to 24 (-2.6 percentage points to 63.0%) and people aged 55 and older (-0.4 percentage points to 36.5%). Among youth, the participation rate fell at a faster rate among students (-2.7 percentage points to 45.0%) than non-students (-0.9 percentage points to 86.6%) over the period (not seasonally adjusted).
Chart 2
Unemployment rate increases to 6.1% in March
Unemployment rate up among youth
In March, the youth unemployment rate rose 1.0 percentage points in the month to 12.6%, and was up 3.1 percentage points from a recent low of 9.5% observed in March 2023.
The youth unemployment rate in March 2024 was the highest since September 2016, excluding 2020 and 2021, during the pandemic. On a year-over-year basis, the unemployment rate was up for both young men (+3.3 percentage points to 13.4%) and young women (+2.9 percentage points to 11.7%). Among youth, the unemployment rate increased more for students (+3.8 percentage points to 12.6%) compared with non-students (+2.8 percentage points to 13.4%) from March 2023 to March 2024 (not seasonally adjusted).
In March, the unemployment rate increased by 0.2 percentage points to 4.8% for core-aged women, and by 0.2 percentage points to 5.5% for core-aged men. On a year-over-year basis, among those aged 25 to 54, the unemployment rate was up by 1.0 percentage points for men, and up by 0.5 percentage points for women.
Among people aged 55 and older, the unemployment rate was little changed at 4.5% in March. On a year-over-year basis, it was up by 0.4 percentage points to 4.9% for men and unchanged at 4.1% for women.
Unemployment rate increases more for core-aged Black Canadians
From March 2023 to March 2024, the unemployment rate rose 3.9 percentage points to 10.8% among core-aged Black Canadians, with increases among both core-aged Black men (+5.5 percentage points to 10.6%) and women (+2.4 percentage points to 11.1%). Over the same period, the unemployment rate increased by 1.8 percentage points to 6.7% for core-aged South Asian Canadians and 1.1 percentage points to 7.2% for core-aged Chinese Canadians (three-month moving averages; not seasonally adjusted).
Among the non-racialized, non-Indigenous population of core working age, the unemployment rate increased 0.5 percentage points to 4.4% over the 12-month period ending in March 2024 (three-month moving averages; not seasonally adjusted).
Employment falls in three industries, led by accommodation and food services
Employment fell by 27,000 (-2.4%) in accommodation and food services in March. Employment in this industry in March was little changed from a year earlier, and was down by 118,000 (-9.6%) from its pre-pandemic level of February 2020. In March 2024, youth aged 15 to 24 accounted for 41.4% of workers in accommodation and food services, close to double the proportion in wholesale and retail trade (23.4%) and information, culture and recreation (23.4%), the industries with the next-highest shares of young workers (not seasonally adjusted).
In March, employment in wholesale and retail trade decreased by 23,000 (-0.8%). Despite an increase recorded in January, employment in this industry has generally trended down since August 2023, with a net decrease of 76,000 (-2.5%) over the period.
Employment in professional, scientific and technical services fell by 20,000 (-1.0%) in March, offsetting the increase in February (+18,000; +0.9%). Over the past 12 months, employment in this industry has grown by 58,000 (+3.1%) with most of the growth occurring from July to December 2023.
Employment in health care and social assistance increased by 40,000 (+1.5%) in March. Employment in this industry has increased steadily since May 2023, with a cumulative increase of 123,000 (+4.7%) over the period. According to the most recent data from the Job Vacancy and Wage Survey, the number of unfilled positions in health care and social assistance was 133,100 in January 2024, down by 15,700 (-10.5%) compared with the same month a year earlier, but still representing over one in five (21.1%) job vacancies across all industries.
Employment in construction increased by 15,000 (+1.0%) in March but was little changed compared with March 2023. Employment increased in finance, insurance, real estate, rental and leasing (+11,000; +0.8%) in March 2024, following little change in February and an increase of 28,000 in January. In March, employment also increased in utilities (+4,300; +2.8%).
Chart 3
Employment falls in accommodation and food services in March
Employment declines in Quebec, Saskatchewan and Manitoba in March, while Ontario posts an increase
After five consecutive months of little change, employment in Quebec declined by 18,000 (-0.4%) in March and the unemployment rate increased 0.3 percentage points to 5.0%.
Nearly two-thirds of the employment decline in Quebec was among youth (-11,000; -1.8%). In the 12 months to March 2024, overall employment in Quebec was little changed, while the working-age (15 years and older) population in the LFS grew by 2.1%. As a result, the employment rate in Quebec fell 0.9 percentage points during the period to 61.3% in March.
Employment in Ontario increased by 26,000 (+0.3%) in March, the second increase in three months. Meanwhile, the unemployment rate rose 0.2 percentage points to 6.7% as more people searched for work. Employment gains in the month were mostly among core-aged women (+20,000; +0.8%) and men (+11,000; +0.4%). By industry, the largest increases in employment were in health care and social assistance (+15,000; +1.5%), transportation and warehousing (+13,000; +3.1%) and construction (+11,000; +2.0%). In the 12 months to March 2024, the employment rate in Ontario fell 1.4 percentage points to 60.7% as total employment grew by 1.1% (+86,000), while the working-age population in the LFS grew by 3.6% (+453,000).
Employment fell by 6,000 (-1.0%) in Saskatchewan in March, the second decline in three months. The unemployment rate in Saskatchewan increased in March to 5.4% (+0.4 percentage points).
Employment fell in Manitoba (-4,300; -0.6%) in March, the second consecutive monthly decrease, and the unemployment rate rose 0.5 percentage points to 5.0%. Despite the increase, the unemployment rate in Manitoba remained, with Quebec, the lowest among the provinces.
For further information on key province and industry level labour market indicators, see “Labour Force Survey in brief: Interactive app.”
Map 1
Unemployment rate by province and territory, March 2024
St. Catharines–Niagara records largest year-over-year increase in unemployment rate
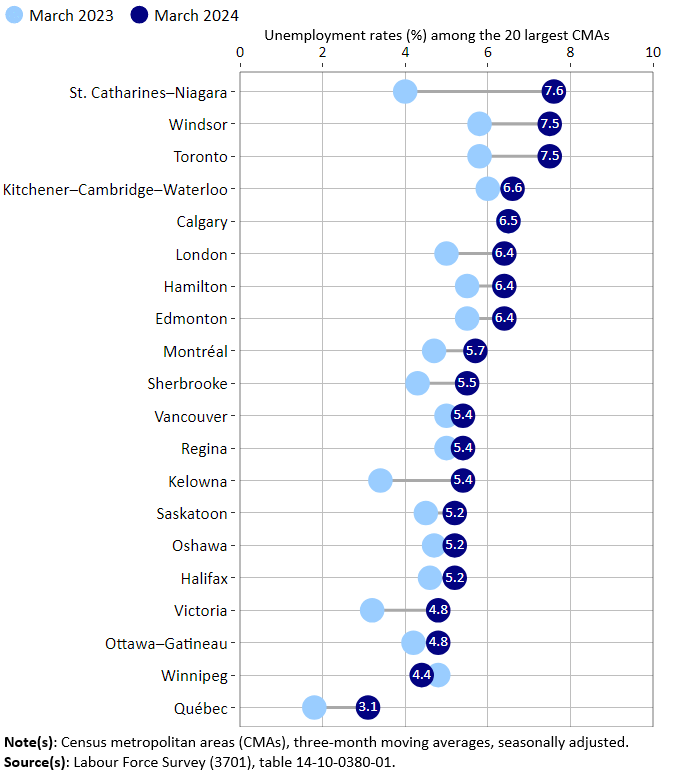
Mirroring the trend at the national level, the unemployment rate was up in 13 of the 20 largest census metropolitan areas (CMAs) on a year-over-year basis in March. The CMA of Winnipeg saw the only decrease in the unemployment rate over that period, while it was little changed in the other six CMAs.
The largest increase was in St. Catharines–Niagara, where the unemployment rate rose 3.6 percentage points to 7.6%, the highest unemployment rate among the CMAs. The unemployment rates in Toronto and Windsor each increased 1.7 percentage points to reach 7.5% in March, and were sitting just below the rate in St. Catharines–Niagara (three-month moving averages).
For the sixth consecutive month, Québec (3.1%) had the lowest unemployment rate among the 20 largest CMAs. This was followed by Winnipeg (4.4%), Victoria (4.8%) and Ottawa–Gatineau (4.8%) (three-month moving averages).
Infographic 1
Unemployment rate up in 13 of the 20 largest census metropolitan areas
