Consumer Price Index, October 2024

November 19, 2024
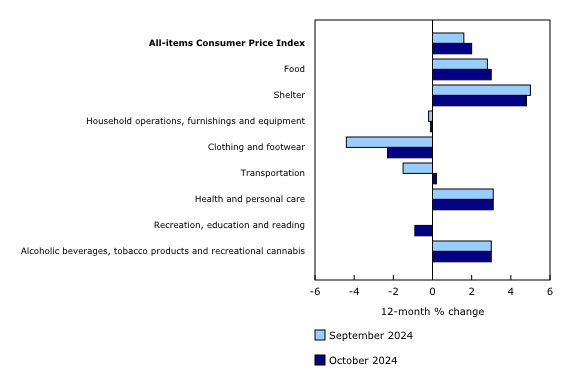
The Consumer Price Index (CPI) rose 2.0% on a year-over-year basis in October, up from a 1.6% increase in September, as gasoline prices fell to a lesser extent in October (-4.0%) compared with September (-10.7%). The all-items CPI excluding gasoline rose 2.2% in October, the same growth rate as in August and September.
Prices for goods rose 0.1% on a year-over-year basis in October, following a 1.0% decline in September. In contrast, prices for services decelerated in October, rising 3.6%, the smallest yearly increase since January 2022. Over the past three years, prices for goods rose 10.2%, while prices for services increased 14.2%.
On a monthly basis, the CPI rose 0.4% in October following a 0.4% decline in September. On a seasonally adjusted monthly basis, the CPI increased 0.3%.
Chart 1
12-month change in the Consumer Price Index (CPI) and CPI excluding gasoline

Chart 2
Prices increase in five of the eight major components in October

Smaller year-over-year decline in gasoline prices
Year over year, gasoline prices fell to a lesser extent in October (-4.0%) compared with September (-10.7%). The smaller decline is partly attributed to a base-year effect, as prices fell 6.4% month over month in October 2023, stemming from lower refining margins and weaker global oil consumption.
On a monthly basis, prices for gasoline were up 0.7% in October, following a 7.1% decline in September.
Chart 3
Prices for gasoline rise on a monthly basis in October

Slower rise in shelter prices
Shelter price growth continued to ease in October, rising 4.8% year over year, compared with a 5.0% increase in September. Slower price growth in the mortgage interest cost index in October (+14.7%) compared with September (+16.7%) applied downward pressure on the shelter component. Mortgage interest costs have been decelerating on a year-over-year basis since September 2023, following a peak in August 2023 (+30.9%).
Similarly, prices for rent grew at a slower pace in October, increasing 7.3% on a year-over-year basis, following an 8.2% gain in September. Nova Scotia (+5.2%) and Manitoba (+6.5%) decelerated the most. Although slowing, prices for rent continue to increase and remain elevated. Compared with October 2021, prices for rent increased 21.6%.
Chart 4
Slower rise in shelter prices in October

Prices for food purchased from stores rise at a faster pace
Prices for food purchased from stores rose at a faster pace year over year in October (+2.7%) compared with September (+2.4%). This was the third consecutive month price growth for groceries outpaced headline inflation. Notable contributors to the acceleration were higher prices for other fresh vegetables (+7.3%) and preserved fruit and fruit preparations (+7.6%). The acceleration was moderated by downward pressure from fresh or frozen beef in October (+7.0% compared with +9.2% in September), among other food items.
Chart 5
Price growth for groceries remains above the all-items Consumer Price Index (CPI) in October

Regional highlights
Year over year, prices rose at a faster pace in October compared with September in all provinces.
Chart 6
The Consumer Price Index rises at a faster pace in all provinces on a year-over-year basis in October

Property taxes increase
Priced annually in October, property taxes and other special charges rose 6.0% on a year-over-year basis, compared with a 4.9% increase in October 2023. This was the highest yearly increase since 1992.
Year over year, property taxes and other special charges rose in all provinces in 2024, with prices increasing the most in Newfoundland and Labrador (+9.7%) followed by British Columbia (+8.0%).
Property taxes and other special charges are determined by four factors: the assessed value of homes, municipal and provincial tax rates, charges levied by municipalities for specific services such as wastewater and garbage collection, and homeowner tax rebates.
Chart 7
Property taxes and other special charges increase in all provinces


