Canada’s Underground Economy Steady at $42.4 Billion
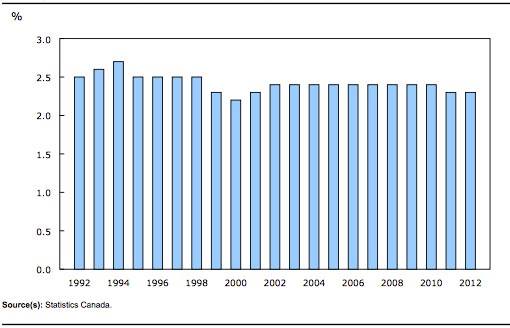
In 2012, total underground activity was $42.4 billion in Canada or about 2.3% of gross domestic product (GDP). This proportion had trended down during the mid- to late 1990s from a high of 2.7% in 1994 to a low of 2.2% in 2000. However, after a brief uptick in the early 2000s the proportion remained relatively stable between 2.3% and 2.4%.
Chart 1: Underground economy as a proportion of GDP, 1992 to 2012
In 2012, these four industries accounted for two-thirds of the total underground economy value added:
• residential construction (28.3%)
• finance, insurance, real estate, rental and leasing and holding companies (13.8%)
• retail trade industry (12.2%)
• accommodation and food services industry (11.6%)
Underground economic activity can also be examined from an expenditure perspective. In 2012, household final consumption expenditure accounted for 65.2% of underground economy activity. Business gross fixed capital formation accounted for another 28.4%, exports 9.2% and imports negative 2.9%.
Underground activities related to household final consumption expenditure could have amounted to $2,025 per household in 2012. The top five categories of underground activity per household were related to expenditures on food and beverage services ($408 per household), paid rental fees for housing ($388 per household), tobacco ($164 per household), alcoholic beverages ($151 per household) and the operation of transportation vehicles ($117 per household).
Examined from the income-based approach, the largest share of the underground economy income went to employees (47.7%), followed by corporations (28.8%) and unincorporated businesses (23.4%). Wages paid under the table and undeclared tips accounted for an estimated $20.3 billion in 2012 or equivalent to 2.2% of the official GDP estimates of compensation of employees. This amount represented $1,466 for every job in the business sector in 2012.
Underground economy by province and territory
The total value of underground economic activity in 2012 was the highest in the four largest economies: Ontario ($15.3 billion), Quebec ($10.4 billion), British Columbia ($5.9 billion) and Alberta ($4.8 billion).
Between 2007 and 2012, underground activity increased in every province. Saskatchewan (+39.6%) and Newfoundland and Labrador (+31.1%) recorded the largest gains, while the Northwest Territories (+5.4%) and Nunavut (+7.1%) posted the smallest.
Despite changes in the value of underground activity, the underground economy as a proportion of GDP remained relatively stable in every province and territory. The underground economy as a proportion of GDP was the largest in Prince Edward Island, while Nunavut and the Northwest Territories had the smallest share.
Chart 2: Underground economy as a proportion of official GDP by province and territory, 2012
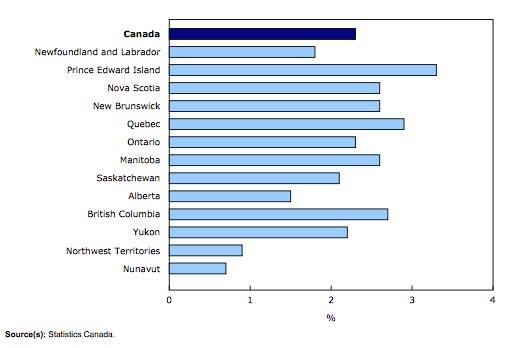
The underground economy accounted for 3.3% of GDP in Prince Edward Island in 2012. Retail trade as well as accommodation and food services, which the study assumes are most likely to have underground activity, make up larger shares of Prince Edward Island’s GDP relative to other provinces. These industries, along with residential construction and manufacturing, account for the majority of underground activity in Prince Edward Island.
As a proportion of GDP, Nunavut and the Northwest Territories had the smallest underground economy, accounting for 0.7% and 0.9% respectively. This study assumes that there is no underground activity in the government sector, and that under reporting of revenues (or over reporting of expenses) is less likely to occur in highly regulated industries or in large businesses. Public administration and mining, quarrying and oil and gas extraction make up large shares of the economies in Nunavut and the Northwest Territories.
Source: Statistics Canada, http://www.statcan.gc.ca/daily-quotidien/150429/dq150429c-eng.htm?cmp=mstatcan.


