Building permits, December 2021
Feb 2, 2022
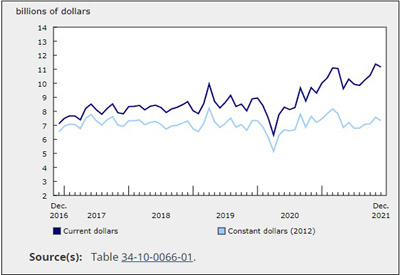
The total value of building permits decreased 1.9% to $11.2 billion in December. Declines were reported in both the residential and non-residential sectors.
On a constant dollar basis (2012=100) the total value of building permits decreased 3.1%.
Residential sector pulls back slightly following strong month
The total value of residential permits decreased 2.7% to $7.7 billion following a strong November (+13.3%).
Multi-family permit values declined 6.0% to $4.1 billion, with British Columbia (-20.3%) responsible for most of the national decline, reversing November’s gain.
Construction intentions for single family homes were up 1.3% to $3.6 billion, led by Quebec (+14.6%). This was the third consecutive monthly increase for this component at the national level.
Institutional and industrial gains cancelled out by commercial component
The total value of commercial permits fell 7.9% to $1.9 billion in December. Most of the decline came from Alberta’s 55.6% drop, reflecting the BMO Centre permit issued the previous month.
Construction intentions in the industrial sector rose 8.4% to $762 million. A $46 million aluminium mining building renovation permit in Quebec (+49.9%) contributed notably to the component.
The value of institutional building permits increased 17.2% to $720 million. Eight provinces reported increases, led by British Columbia.
Overall, the total value of non-residential permits remained unchanged at $3.4 billion as movements within the various components cancelled each other out.
Fourth quarter of 2021 hits new heights
The total value of building permits in the fourth quarter of 2021 jumped 10.3% to a new high of $33.1 billion. This surpassed the previous record of $31.5 billion set in the first quarter of 2021.
The residential sector increased sharply by 11.9% to a record $22.7 billion, contributing almost four-fifths of the overall total building permit value increase. Both permit values for multi-family and single family components rose strongly compared with the third quarter, with the multi-family component exceeding $12 billion for the first time.
The non-residential sector rose 7.0% to $10.4 billion in the fourth quarter, 2.3% below the pre-pandemic peak set in the fourth quarter of 2019. Commercial permits were up 9.9% to $5.9 billion, while institutional and industrial permits rose 3.1% and 4.0%, respectively.
Annual review of 2021: a hot residential market
The total value of building permits surged 25.6% to $126.5 billion in 2021, the strongest annual growth ever recorded. However, material price and labour cost increases in the construction industry accounted for almost two-thirds of the increase. On a constant dollar basis (2012=100) the total value of building permits still increased by a robust 9.3% to $88.5 billion.
Construction intentions in the residential sector in 2021 were up 29.9%, reaching a record $87.2 billion. Single family permit values jumped 41.5% to $40.7 billion, representing 81,000 new units—the most since 2013. Canadians showed interest in moving away from larger city centres over the course of 2021, with smaller census metropolitan areas (CMAs) such as Peterborough (+134.1%), Barrie (+107.5%), Oshawa (+79.0%) and Kelowna (+75.8%) reporting large gains in construction intentions.
Multi-family permit values also hit a record high for the year, rising 21.1% to $46.5 billion. Similar to the trends in single family construction, the multi-family component also saw faster growth in smaller CMAs such as Kelowna (+175.1%), Lethbridge (+159.0%), Saguenay (+145.1%) and Trois-Rivières (+120.3%).
The non-residential sector in 2021 was up 17.1% to $39.6 billion, continuing its recovery to 2019 levels. Only the institutional component exceeded pre-pandemic levels, while the commercial and industrial components were both roughly 8% below 2019 totals.
To explore data using an interactive user interface, visit the Building permits: Interactive Dashboard.
To explore the impact of COVID-19 on the socioeconomic landscape, please consult the Canadian Economic Dashboard and COVID-19.
For more information on housing, please visit the Housing Statistics portal.
Statistics Canada has a Housing Market Indicators dashboard. This web application provides access to key housing market indicators for Canada, by province and by CMA. These indicators are updated automatically with new information from monthly releases, giving users access to the latest data.
Go HERE for more information.