Third Quarter GDP Grew 0.3%

Nov 29, 2019
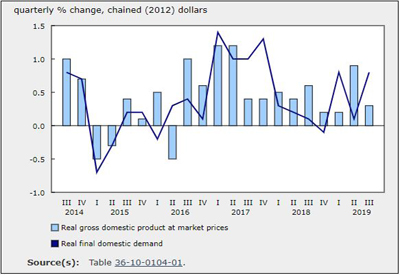
Real gross domestic product (GDP) grew 0.3%, following a 0.9% increase in the second quarter. Third quarter growth was led by higher business investment and increased household spending, boosting final domestic demand by 0.8%.
Expressed at an annualized rate, real GDP advanced 1.3% in the third quarter. In comparison, real GDP in the United States grew 1.9%.
Business investment rose 2.6%, the fastest pace since the fourth quarter of 2017. Growth in household spending accelerated to 0.4%, after rising 0.1% in the second quarter. These increases were moderated by a 0.4% decline in exports, while imports were flat.
Non-farm business inventories were drawn down by $550 million in the third quarter, and the economy-wide stock-to-sales ratio hovered at 0.84. Cannabis inventories contributed to the $4.9 billion accumulation of farm inventories.
Business investment rose 2.6% in the third quarter, the fastest pace since the fourth quarter of 2017. Growth in household spending accelerated to 0.4%, after rising 0.1% in the second quarter. These increases were moderated by a 0.4% decline in exports, while imports were flat.
Non-farm business inventories were drawn down by $550 million in the third quarter, and the economy-wide stock-to-sales ratio hovered at 0.84. Cannabis inventories contributed to the $4.9 billion accumulation of farm inventories.
Housing investment accelerates
Housing investment rose 3.2%, the fastest pace since the first quarter of 2012. The increase was driven by both new home construction (+3.3%)—mostly single-detached homes in Ontario—and higher ownership transfer costs (+8.7%) from increased resale activities in British Columbia and Ontario.
Business investment grows
Business investment in non-residential buildings was up 1.4%, after rising 1.0% in the second quarter. Growth in business investment in engineering structures accelerated to 3.1%, the fastest pace since the third quarter of 2016. Business investment in machinery and equipment rose 1.7%, after falling 6.0% in the second quarter, while investment in intellectual property products rose 1.5%, matching the previous pace of growth.
Moderate growth in household spending
Household spending rose 0.4% in the third quarter, after edging up 0.1% in the second quarter. Outlays on durable goods rebounded 0.4%, after declining by the same rate in the previous quarter. The increase was largely driven by purchases of new trucks, vans and sport utility vehicles (+4.9%)—the sharpest rise since the third quarter of 2015.
Outlays on semi-durable goods rose 0.5%, and outlays on non-durable goods advanced 0.3%. Growth in household spending on services, representing over half of total household spending, accelerated to 0.4%, after rising 0.2% in the second quarter.
Export volumes fall
Export volumes declined 0.4%, after rising 3.1% in the second quarter. Notable downturns occurred in exports of non-metallic minerals (-15.2%) and farm and fishing products (-4.5%). These declines were partly offset by higher exports of metal ores and concentrates (+11.6%), and clothing and footwear products (+17.3%). Exports of services were essentially unchanged.
Import volumes remained flat in the third quarter, following a 0.9% drop in the second quarter. Increases in imports of basic chemical products (+5.4%), and pharmaceutical and medicinal products (+5.2%) were offset by declines in imports of passenger cars and light trucks (-2.2%) and industrial machinery, equipment and parts (-1.5%). Imports of services further declined 0.4%, after a 1.8% drop in the second quarter.
Terms of trade decline
The third quarter decline in export prices (-1.5%), largely owing to a 10.9% drop in prices of exported crude oil and bitumen, was twice that of import prices (-0.7%). Consequently, the terms of trade—the ratio of the price of exports to the price of imports—dropped in the third quarter (-0.9%), offsetting the 0.8% gain in the second quarter.
The GDP implicit price index, which reflects the overall price of domestically produced goods and services, edged up 0.1%.
Corporate earnings fall while household disposable income increases
Gross operating surplus of corporations fell 2.4% (nominal terms) in the third quarter, after rising 4.1% in the second quarter. Compensation of employees rose 1.3%, after increasing 1.5%. Growth in compensation of employees was led by service-producing industries (+1.5%).
Household disposable income rose 0.9%, while nominal household spending increased 0.6%, resulting in an increase in household savings. The household saving rate rose to 3.2%.
Source: Statistics Canada, www150.statcan.gc.ca/n1/daily-quotidien/190830/dq190830a-eng.htm


