Wholesale Trade Up 1.0% in September

Nov 27, 2019
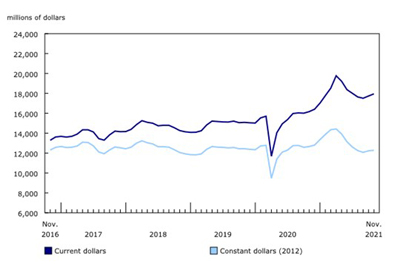
Wholesale trade rose 1.0% to $65.1 billion in September, almost entirely offsetting the 1.2% decline in August. Sales were up in five of seven subsectors, representing 82% of total wholesale sales.
In dollar terms, the machinery, equipment and supplies, the personal and household goods, and the food, beverage and tobacco subsectors contributed the most to the increase in September, while the motor vehicle and motor vehicle parts and accessories subsector posted the largest decline.
In volume terms, wholesale sales increased 0.9%.
In the third quarter, sales increased 0.8%, the fourteenth consecutive quarterly increase. Quarterly sales increased in four of seven subsectors, led by the personal and household goods (+3.2%) and the miscellaneous (+3.7%) subsectors.
Increase in September attributable to higher sales in five of seven subsectors
In dollar terms, the machinery, equipment and supplies subsector reported the largest increases in September, as sales rose 4.4% to $13.9 billion. This was the first increase in three months for the subsector. However, sales in September were not strong enough to lift the subsector to positive third quarter results, with the subsector recording its first quarterly decline since the second quarter of 2016. In September, gains were reported in all four industries of this subsector, with the construction, forestry, mining and industrial machinery, equipment and supplies industry (+6.8%) contributing the most to the growth. The last time all four industries increased in the same month was in October 2018. In September, the Canadian International Merchandise Trade Program reported imports of logging, construction, mining and oil and gas field machinery and equipment were up 2.2%.
Sales in the personal and household goods subsector increased 1.0% to $9.6 billion in September as all five industries reported gains.
In the food, beverage and tobacco subsector, sales increased 0.6% to $12.1 billion in September, partly offsetting the 1.0% decline in August. Gains were reported in two of three industries, with the food industry contributing the most to the rise. On a quarterly basis, this subsector was up 0.4%, the fifth consecutive increase.
Sales in the motor vehicle and motor vehicle parts and accessories subsector decreased 0.8% to $11.2 billion in September. Lower sales in the motor vehicle and parts industry (-0.9%) contributed the most to the decline. In the third quarter, sales in this subsector decreased 0.1%, the first decline in three quarters.
Higher sales in nine provinces
Wholesale sales rose in nine provinces in September, representing 98% of the total wholesale sales. In dollar terms, Quebec, British Columbia and Alberta accounted for most of the gains.
Sales in Quebec recorded the largest increase in September, up 2.5% to $12.2 billion following a decline of 2.2% in August. Sales were led by the machinery, equipment and supplies subsector, which grew 9.5% to $1.9 billion in September, offsetting most of the declines in the previous two months. All industries within this subsector posted higher sales.
Wholesalers in British Columbia reported the second largest sales, up 2.1% to $6.6 billion, the fourth consecutive increase. The increase was led by the food, beverage and tobacco (+5.4% to $1.5 billion) and the motor vehicle and motor vehicle parts and accessories (+6.3% to $781 million) subsectors. For both subsectors the increase in September came after a decline in August.
In Alberta, following two consecutive declines, sales increased 1.9% to $6.9 billion in September primarily due to higher sales in the machinery, equipment and supplies subsector (+6.0% to $2.2 billion). While all industries within this subsector posted higher sales, the construction, forestry, mining, and industrial machinery, equipment and supplies industry contributed the most. Despite the increase in September, year-to-date wholesale sales in Alberta were 0.5% lower compared with the first nine months of 2018.
The only province where sales declined in September was Manitoba (-1.4%), the second consecutive decline. Sales in all but the personal and household goods subsector declined, with the motor vehicle and motor vehicle parts and accessories subsector (-8.7%) contributing the most to the decrease.
Sales in Ontario remained flat as higher sales in the machinery, equipment and supplies subsector (+2.6%) were offset by lower sales in the motor vehicle and motor vehicle parts and accessories (-1.5%) and the food, beverage and tobacco (-1.9%) subsectors.
On a quarterly basis, higher sales were recorded in eight provinces in the third quarter. Ontario led with a 2.2% increase, followed by British Columbia (+0.9%). This was the fourth consecutive quarterly increase for Ontario and the second consecutive increase for British Columbia. Alberta and Newfoundland and Labrador were the provinces with lower sales in this quarter, each down 4.1%.
Inventories decline for second consecutive month
Wholesale inventories decreased 0.7% to $92.3 billion in September, the second consecutive monthly decline. Decreases were recorded in five of seven subsectors, representing 53% of total wholesale inventories. Following 12 consecutive quarterly increases, inventories declined 0.9% in the third quarter of 2019.
Inventories in the motor vehicle and motor vehicle parts and accessories subsector decreased for the second consecutive month, down 2.7% to $13.0 billion. Almost 84% of the decline in this subsector was attributable to lower inventory levels in the motor vehicle industry.
In the food, beverage and tobacco subsector, inventories fell 2.9% to $8.8 billion, the third consecutive monthly decline. The food industry contributed the most to the decrease.
The personal and household goods (+0.6%) and the machinery, equipment and supplies (+0.3%) subsectors recorded the only gains in inventories for September.
The inventory-to-sales ratio decreased from 1.44 in August to 1.42 in September. Prior to this month, the last time a similar drop in the ratio was observed was in March of 2018. The inventory-to-sales ratio is a measure of the time (in months) required to exhaust inventories if sales were to remain at their current level.
Source: Statistics Canada, https://www150.statcan.gc.ca/n1/daily-quotidien/191125/dq191125a-eng.htm