Total Building Permits Rise
The total value of building permits issued by Canadian municipalities rose 8.5% to $7.0 billion in January, following a 4.8% decrease in December. The increase came from higher construction intentions in the residential sector, which more than offset a decline in the non-residential sector.
Gains were posted in every province in January, except Quebec. Alberta, BC and Ontario registered the largest increases.
Chart 1: Total value of permits
After two consecutive monthly decreases, construction intentions for residential dwellings rose 26.3% to $4.6 billion. All 10 provinces posted gains, led by Quebec, Alberta, Ontario and BC.
In the non-residential sector, the value of permits fell 14.6% to $2.4 billion, following a 5.4% increase in December. Decreases in Quebec and, to a much lesser extent, New Brunswick offset the gains posted in the remaining provinces.
Residential sector: much higher construction intentions for multi- and single-family dwellings
Construction intentions for multi-family dwellings rose 42.8% to $2.1 billion, following a 21.9% decrease in the previous month. Advances were posted in nine provinces, with Quebec, Alberta and BC accounting for most of the gain. Saskatchewan was the only province to register a decrease.
The value of building permits for single-family dwellings increased 15.0% to $2.5 billion in January, the highest level since September 2012. The advance in January followed two consecutive monthly decreases. Gains were posted in seven provinces, led by Alberta, Ontario and BC.
Nationally, municipalities approved permits for the construction of 18,366 new dwellings, up 17.4% from December. Permits for multi-family dwellings rose 20.9% to 11,580 units. Permits for single-family dwellings rose 11.8% to 6,786 units.
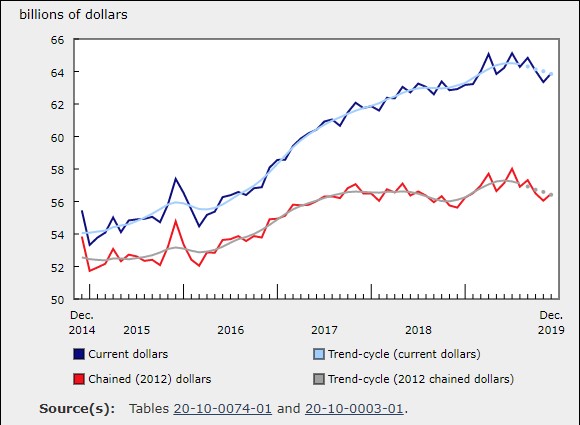
Chart 2: Residential and non-residential sectors

Non-residential sector: declines in institutional and industrial permits
The value of non-residential building permits fell in January. An increase in construction intentions for commercial buildings was not enough to offset declines in the institutional and industrial components.
Construction intentions for institutional buildings fell 41.8% to $574 million, after a 182.9% increase the previous month. This decline was mainly attributable to medical facilities in Quebec. Increases posted in eight provinces were not enough to offset the decline in Quebec.
The value of permits for industrial buildings decreased 24.7% to $373 million, following a 13.9% increase the previous month. Decreases occurred in six provinces, led by Ontario, where the decline was largely attributable to lower construction intentions for manufacturing plants.
In the commercial component, the value of permits increased 9.7% to $1.4 billion in January, following a 29.8% decrease in December. Hotel and restaurants in Ontario accounted for most of the advance. Increases were posted in five other provinces, led by Manitoba and BC.
Most provinces post higher construction intentions
Alberta and BC both posted large advances, mainly as a result of higher construction intentions for residential buildings. In Ontario, commercial and residential buildings were responsible for the increase.
Manitoba and Saskatchewan followed a distant fourth and fifth. Advances in both provinces were tied to higher construction intentions for single-family dwellings and commercial buildings.
Quebec was the only province to register declines, as a result of lower construction intentions for institutional buildings and, to a lesser degree, commercial and industrial buildings.
Higher construction intentions in most census metropolitan areas
Construction intentions were up in 23 of the 34 census metropolitan areas, led by Toronto, Vancouver and Edmonton.
Toronto recorded the largest gains, driven by higher construction intentions for commercial buildings and single-family dwellings. The increase in Vancouver came mainly from multi-family dwellings, while in Edmonton residential, commercial and institutional buildings were responsible for the gain.
The largest declines occurred in Montreal, followed by Hamilton and Calgary. In Montreal, the decrease was principally attributable to institutional buildings. The decline in Hamilton was attributable to lower intentions for commercial and industrial buildings, while in Calgary the decrease resulted from commercial and institutional buildings.
Source: Statistics Canada http://www.statcan.gc.ca/daily-quotidien/140306/dq140306a-eng.htm